Pensions – a 10 year retrospective
‘Pensions: Proliferation and Propaganda – a cooking of the books ?’
by Robert Whiston FRSA
First published Dec 15th 2005
Background
The origins of this document stem back to a paper submitted to Conservative Central Office in the teeth of a 2002 – 2005 gale foretelling the end of private pension schemes and the imminent bankruptcy of the state pension scheme. Indeed, the pension panic gripped the whole of Europe as each nation reassessed its ability to pay.
Ten years on (2015), is an appropriate time to take a retrospective look at those times and see who was the more accurate; the doomsayers or commentators who wrote articles such as this one ?
The political climate at the time led to the appointing of Adair Tuner to look into the looming ‘pensions crisis’ characterised by allegedly increasing numbers of pensioners, in the near future, claiming state benefits (the baby boom years), and simultaneously, a decreasing numbers of young workers to pay taxes (a function of smaller nuclear families) and thus fund Britain’s state ‘pay-as-you-go’ pension scheme. The panic that gripped national governments was the supposed ‘Pensioner Dependency Ratio’ which was set to fall in the decades ahead. In effect this would load the burden of funding slightly more pensioners onto the backs of significantly fewer tax-paying workers (see ‘Pensioner Dependency Ratio’ section below).
Falling stock market returns were cited at the time as the reason for some companies closing down their staff/workers pension scheme. One of the first and significant was the frozen food giant “Iceland” which announced in Feb 2002 that it “final-salary-linked” company pension scheme (the Rolls Royce of pension options) was coming to an end. Even the thousands of workers already in the scheme were forced out and into riskier, lower yielding alternatives.
Company pension schemes, which had grown during the 1980s and 90 as ‘tax efficient’ vehicles for accruing company profits suddenly became a liability. ‘Iceland’, for its part, estimated that annual payments would need to rise from £4m to £14m a year, if pension payments were to be guaranteed. [1]
At the time, the public quite rightly could not see why so many FTSE 100 listed companies now claimed to have pension schemes they could no longer afford, especially when those same companies could still afford to pay six figure pension packages to their CEOs (then a lot of money). The excuse was that it was demographics (e.g. people living longer) and economics – but many of the companies were still making handsome profits.
This, then, had more than a faint whiff of ‘the unacceptable face of capitalism’.[2]
Readers should be aware that politics, even in the era 2000 to 2005, could often be very tribal and ‘red in tooth and claw’ with no quarter given if a supposed political advantage was a possibility.
There were, at the time, key statistical trends that all commentators in the media seemed to be overlooking or discounting and those are listed here. From these keys statistical it was evident that the panic would, in all probability, be a short-lived one. Pensions were, in fact, a distraction from the underlying structural fault lines that were more serious and would finally bring down the edifice.
Nevertheless, it is surprising to now realise just how accurate were many of the predictions made in this 2005 paper.
NB. For ease of reading the verb tense below has been changed from the present, future, and the future conditional to the past tense.
1. Pensions – a general overview
The issue of pensions had in 2005 the capacity to become a class conflict in the traditional mould. It was an issue where ‘New Labour’ had the potential to tear itself in two.
There were an estimated 10m British workers (as at 2005) with no pension other than that provided by the State and the history of recent pension reform (1980s – 1990s) was pockmarked with scandals reminiscent of the ill-fated post-war Tanganyika ‘groundnut scheme’. [3]
A glance at the political left showed socialist, Marxist and trade unionists lining up to confront any possible changes – often on the pretence that it would be unfair to women – if it put those 10 million at a greater disadvantage in the future.
In the more mainstream politics, the trades unions had depicted companies such as Rentokil as rats leaving the sinking ship of defined-benefit (aka final salary) pension provision and condemned many other large companies that were doing the same.
The public couldn’t see why so many FTSE 100 listed companies claimed to have pension schemes they couldn’t afford, especially when many of the companies were still making profits, had roughly the same staffing levels and could still afford to pay six figure pension packages to their CEOs. Did those CEOs really need their state pension when their company pension guarantees them in the region of £100,000 to £300,000 per annum ? This was at a time when NASA’s projects were still measured in millions (not billions) of dollars.
How could the general public rationalise the writing-off of billions of their pounds of African debt by a New Labour government when billions of pounds cannot be found for the pension crisis in Britain. [4]
Domestically, the news that from April 2006 those with private pension schemes could withdraw up to 25% only increased the perceived injustices for those left with no pension at all
So what had changed in the preceding 20 years ? Was it that companies had slid from being cash rich to cash poor ? (Remember, this was long before the ‘banking collapse’ of 2008).What were the economic mechanics at play that made ‘final salary’ schemes so untenable for the working man and office worker ? Why had they become such an albatross around the necks of so many employers ?
One of the explanations offered at the time was that recent low interest rates coupled with increased longevity have both made the ‘defined pension’ promise more expensive to honour. But what conditions better enable a company to afford pension commitments, a period of stable low interest rates, or a period of inflation and high and fluctuating interest rates ?
The proposed alternative namely the ‘money purchase pension’ was no option at all, given that future employment patterns will see serial breaks and disruptions that simply did not occur in the 1945 to 1980 era. Penury in old age loomed ever-larger as falling annuity rates were set to be driven yet lower by government actions, so they continued their fall.
Equity markets move up and down and so do company profits. ‘Pension holidays’ (once a feature of the ‘good times’ of the 1980s), were bound to be transitory and to be followed by steeper pension fund demands. It cannot have escaped the competence of Actuaries and pension companies that longevity was here to stay.
If, as was then claimed, a big pension deficit had become a regulatory ‘brake’ on corporate freedom for many companies, then why not – as one item in a package of measures – alter accounting practices to show the temporary nature of the pension liability as an ‘asset’ in much the same way that balance sheets of High Street banks show their liabilities (i.e. as deferred assets and income from clients) ?
The reason why large companies such as BAe Systems, British Airways, Iceland and Rentokil etc, etc were thinking of closing their schemes to both to new and existing members was in part due to the shambles that is the financial services sector and in part the lack of a mutual umbrella pensions guarantee among trade and professionals (those two predictions as to likely cause came home to roost with a vengeance in 2008 and its aftermath – RW).
Perhaps the biggest omission at the time was the lack of any effective ‘lifeboat’ or final guarantee authority willing to pick up the pieces – even after the warning of the Maxwell Mirror newspaper swindle. The Regulator was happier sending out warning letters than vigorously holding pension funds to account (ref. Turner & Newell pension debacle).
- The idea of an effective ‘lender of last resort’ or ‘lifeboat’ was not new and could be found in Banking textbooks of the 1960s portraying the Bank of England as fulfilling that role. Until the 1970s ‘a run’ on any bank in Britain was unimaginable. But between 1973 and 1975 a crisis emerged in what was called the “secondary banking” system and a ‘lifeboat’ to shield them from ruin was made up of a consortium of larger banks (but guaranteed by the Bank of England). Noteworthy was that this ‘secondary banking crisis’ of 1973–75 was prompted by a dramatic crash in property price following an earlier bubble and against which secondary banking had lent money.[5] See also footnote 5 for Jeremy Thorpe MP’s involvement with London and County Securities which triggered the 1972 crisis.
When people lose out in this way there is either full compensation or poor to no compensation. This was true both of Endowment mortgages and Insurance cover mis-selling. Mis-selling by the City and financial institutions was, by 2005, well under way and only slowly was it being realised among the public.
Currently (in 2005), insurance companies and advisers who had given bad guidance have been forced by the regulator to pay out £11.5 billion in compensation. But it soon emerged that some companies and advisers could not even calculate the correct amount (a faction of the millions of policy holders), while many had been under-compensated for mis-selling.
In 2005 I wrote never imagining the 2008 world banking crisis induced by phony American derivatives that spread like a cancer through worlds financial institutions:
- “Imagine the consequences for every family in Britain if the damn does burst in a catastrophic failure ? What will that do for City’s reputation and earnings abroad ?
- The cost of putting right what should not have gone wrong in the first place will be expensive, but it will be insignificant, over time, compared with the alternatives.”
On the pensions front the trades unions were already preparing to reach for their lawyers. The courts, it was widely expected, might have to decide whether companies offering this final salary pension solution (curtailing it or abolishing it), would be in breach of their contractual obligations to each employee and a situation could have arisen comparable to the protracted Equitable Life legal battle.
2. The Socialist Worker
Information in this section was taken from ‘The Socialist Worker’ website which actually had a great many good articles on the difficulties pensions pose for the majority of citizens. [6] They describe both Alan Pickering’s and Adair Turner’s backgrounds and why the “government knew exactly what sort of report it was likely to get when it appointed” them. To the Socialist Worker it was always going to be “a fat cat charters” written by a fat cats.
As chairman of the National Association of Pension Funds, the organisation to which most large companies’ pension funds belong, they point out that Alan Pickering campaigned to scrap key  rules imposed on private pension funds after the Maxwell scandal.
He was among the first to call for the retirement age to be raised to 70 for both women and men and to question the viability of final salary schemes. Pickering’s own pension, they note, is safely secured with a final salary scheme.
The Socialist Worker website then lists those firms which have already closed off future final salary schemes for new workers include (see list above). NB. see how many are banks (shown in blue) which hit the headlines only a few years later.
Some companies, such as Iceland and the Caparo Group, have gone even further and ended the final salary scheme for existing workers.
 Under the heading, “No worries for some” the Socialist Worker website then lists company “bosses” at the firms involved, i.e. firms who are closing down final salary pensions to workers, and the pension packages that their CEOs can look forward to in retirement [7]
3. The Political Dimension
Millionaires can only become millionaires by selling their goods or services to the working class. Millionaires have never became millionaires by selling their goods or services to the middle class. Historically, it has been the purchases of the working class that has created millionaires – be they John D Rockefeller, George Getty or Richard Branson.
- By way of example: Rockefeller’s Standard Oil Trust was America’s largest oil shipper. It absorbed or bankrupted rivals to control nearly 95% of America’s oil refining by 1879. Before the advent of motor cars oil was used for all household lighting. Not until 1911, by order of the U.S. Supreme Court, was Standard Oil broken up via anti-trust, monopoly, laws (Edison’s electric light bulb eventually replaced oil lamps but by then other uses for oil had been found).
As was pointed out in 2005 “In any event, the traditional middle class – the backbone of any flourishing economy – is now an endangered specie (Essex Uni papers). The numbers are relentlessly declining in our hire-and-fire labour market.”
- “We used to think in Britain of a society divided by class. Increasingly we worry about a society divided by conflicts of culture and identity. But I believe there is another division, even more significant but much less remarked upon. We are also living in a society increasingly divided by age.” – David Willetts MP, Speech to Policy Exchange, 28th Nov. 2005
That might be true, but it is also true that the divide had widened (and this was in 2005) between the wealthy and the poor. In Australia this is called the ‘work rich’ and the ‘work poor’, where the work rich have not one but two or more jobs. Alan Barron, of the Institute of Men’s Studies (Australia), had written of the ‘work rich’ and ‘work poor’ divide. Out of work young men are most badly disadvantaged (see Flinders Uni papers).
In the UK we see the ‘work rich’ phenomenon most clearly where celebrities are invited to join still more well paid part-time jobs, e.g. Baroness Pitkeathley, CAFCASS, the Lottery board etc. These jobs often carry pensions and so the gulf between those with multiple pensions and those with none or only one, becomes ever wider.
Pensions, even today, are a topic perceived to be totally in the thrall of remote figures and any changes introduced are by those with least invested in the subject, that is to say they are well catered for already in regards their own (private) pensions arrangements. Writing at the time I said that:
- “The controversial issues that surrounded pensions in 2006 was of another class issue in nature. It will be the wealthy and the middle class dictating to the poor, the unemployed and the working class, what they will receive and how lucky they will be to get it.”
Both the Alan Pickering and Adair Turner reports epitomised this dichotomy with both men shielded by their well-paid, secure and pension-enhanced jobs – a view that could have been dismissed as the product of envy but a strongly held view nonetheless.
The reason why this perspective (of a crude class conflict) should not have been overlooked was because New Labour, by moving to ‘the right’ had left the trade union movement and all their working class members wholly unsupported and unrepresented. (NB. this ‘working class’ has now become the Tory’s “hard working families” mantra of the 2014 -15 election).
Listening to journalists and some politicians it appeared in 2005 that they have forgotten that for many millions of households there is simply not a £20 note to spare at the end of each week for extra pension provision. (This was, at the time, yet another suggested ‘cure’ for the working class to improve their lot and become more responsible).
Those that have been waged know that all their wages, and more, had been spent by Thursday night (a portent offered even then of the rise we see in 2015 of the ‘pay day’ loan companies – RW). These are the working people who take those jobs advertised in Jobcentres where the predominating pay rate is the National Minimum wage.
These are the very people who will be most affected by the frequent disruptions in their work life and therefore more likely to have gaps in their NIC contribution history (and yet were being expected to contribute to their pension pots as if they were in secured and salaried employment – RW).
Pensions should have been a policy that threatened to become a pivotal issue for Labour voters in the last general election in May 2005 (I wrote in Dec 2005). That it didn’t, indicates either ineptness by the Conservative Party or shrewd avoidance tactics by the Labour Party.
The pensions issue could be New Labour’s Poll Tax debacle. A glance at left-wing political organisations point to it as Labour’s Achilles heel. Socialist Worker, for instance, while not large in membership was indicative of the subterranean mood regarding the gap between rich and poor that had widened during the Blair years. It was foolish not to take on board their comments for which the Conservative Party could have gained politically (unless their attitude wa akin to the present SNP which is to be anti-Tory at any cost).
I have to confess that in 2005 I was not at all convinced by ‘globalisation’ and saw it bringing poverty to the West while allowing wealth and prosperity to spread eastwards. Thus I wrote:
- “With globalisation – the current buzz word – and the exporting of jobs overseas the impediments working people face in funding their retirement becomes ever more problematical. For no matter how cheap products can be made in China there still had to exist a vibrant UK economy capable of purchasing what is produced.”
The thinking behind that statement was that in order to sustain production, say, in China, then consumer demand would have to be artificially stimulated and, in the worst case scenario, I could visualise ‘credits’ being issued to families by governments (like wartime food rationing cards), to buy goods made overseas just to maintain the flow of trade.
4. Pension Doom and Gloom
The decline of the state pension featured prominently in left-wing literature of the time. The projections as to the State Pension’s future purchasing power (to 2050) is shown in the graph below.
Graph – Decline in (UK) state pension (as %age of average incomes)

At present the value of the British old age pension (in 2005), was 20% of average earnings and this was forecast by the Socialist Worker to slump to 5% in 2050 (based on official figures). In 2005, 5% of Britain’s Gross Domestic Product (GDP) went to pay for pensions. The government’s official statistics say that in 2050 this will only be 5.7% of the county’s GDP. [8]
British pensions are the most miserly when compared to the 25 nations of the EU, or when compared to New Zealand. The basic state pension in the United Kingdom (the equivalent to the U.S.’s Social Security system) was lower in 2005 than every European country save for: Portugal, Greece, Belgium, and Ireland. It was also substantially below that of its U.S. counterpart. The reason for the comparatively poor performance of the State pension was the de-coupling in the 1990s of pensions from wage and instead its attachment to retail prices.
Wages had historically risen by 1.5% to 2% ahead of inflation each year (American wages too rise ahead of inflation, so Pres. Bush’s current proposal to switch to the British format has a 30 year time bomb embedded in it). Two percent doesn’t sound like much, but in retrospect, the value of benefits (with the ravages of increases in real living costs and compound interest) result in a near 50% reduction in the value of benefits (i.e. its purchasing power).
In the past the UK’s pension regime appeared to work well because it had one of the most generous employer-backed pension systems in Europe. Aggregate assets in U.K. pension funds far outstripped the value of similar funds on the continent. In a recent report, the Pensions Commission acknowledged this very point. The Commission wrote;
- “…. one of the least generous systems in the developed world was complemented by the most developed system of voluntary private funded pensions ….. This rosy picture always hid multiple inadequacies relating to specific groups of people, but on average the system worked.”
5. Brief chronology of pension evolution & reform
In order to maintain momentum, this section has now been moved to Appendix 1 below.
6. Generational game
The press had recently (in 2005) made something of a fuss about the apparent inequalities that the younger generation will bear for future pension payments. For instance, the programme “Analysis”, (BBC Radio 4, Dec 15th 2005), suggested that the generation that is now under 35 will be the first to pay for a Welfare State from which it will derive comparatively little benefit. But isn’t this only true if the present pay-as-you-go regime ceases ? (NB. The assumption was that the first female baby boomers would begin collecting their pension in 2007 followed by male baby boomers in 2012).
This view entirely overlooked the ‘baby boom’ generation of 1947 who have yet to draw pensions but now that it’s close to the time for them to think about pensions they were being threatened with their company’s pensions schemes collapsing while the Gov’t was paralysed to alleviate the situation because of its pensions ‘rethink’.
Having paid in to the system all their lives ‘baby boomers’ were naturally fretful (if not resentful) that they would be short-changed with less attractive pensions in the same way that they have already lost out on:
- mortgage endowment polices that are worth half their face value
- frozen levels of various state benefits
- the withdrawal of free university and FE places
- the withdrawal of tax-efficient saving plans and allowances
- the collapse of occupational pensions
- the collapse of final salary pension scheme
- the withdrawal of family allowances (which impact on marriage and legitimacy levels and which tax-payers have had to subsidise)
This “me-ism” totally ignored the hard facts that the baby boomers were the first generation to pay pensions for those older people who had not contributed or contributed on a much smaller scale to the less generous system existing before the 1939 – 45 war.
The then current 40% increase in housing demand (from SMH ?) in an otherwise static population had resulted in a denial of access to the first rungs of the property ladder for their adult children of baby boomers. Theses children will now have to “inherit” rather than aspire to buy their own home.
All this adds up to potential poverty in old age for baby boomers – the very thing that 50 years ago the Beveridge Plan sought to eliminate. (NB. this poverty would be caused by living with having to live relatives, increases in housing taxes, selling homes to pay for end of life residential care, and property inheritance tax avoidance to name but a few).
Unlike the under-35-years-olds, the baby boomers have actually paid into the system but unlike the baby boomers, the under 35 years olds are in the main ‘singletons’ and have yet to have children of their own.
These ‘singletons’ together with politicians fail to realise that “the engine of wealth creation is the married man.” They choose to fail to realise it because the married man is now unfashionable and he is no longer passively supported by the state, even though he brings them both stability and greater incomes to tax.
There is a need to quickly digress here. These ‘singletons’ together with politicians fail to realise that “the engine of wealth creation is the married man.” They choose to fail to realise it because  the married man is now unfashionable and he is no longer passively supported by the state, even though he brings them both stability and greater incomes to tax. This Table distils the diametrically opposed cultural views of authors Patricia Hewitt, of the IPPR, and US Presidential adviser George Gilder. By a circuitous route they arrive at a common destination that they interpreted in a violently different manner. Both agree that single men and women earn the same pay; both agree that married men earn 1.7 more than single men and women; and both agree that married women earn least of all (varying from 0.6 to 1.02). For her part Hewitt (circa 1991), wanted all women to earn the same as a married man but Gilder points out that the married man had incentives to provide at levels which the other categories lack (i.e. family, school, college fees, home, car, holidays, etc). As such he will always tend to earn more whatever obstructive legislation is placed in his way.
Every survey into social values and priorities had shown that the welfare state, including the NHS and pensions, are not to be tinkered with lightly. There is a wish that they remain as they are, even if they creak and have to be amended and uprated from time to time. There is a capacity, a well-spring within society, to make the necessary payments needed to fund the NHS if an acceptable consensus vehicle for change can be found.
Will people born after 1970 be compelled to be more self-reliant than their parents ? Will they also be more selfish ? The answer is an emphatic ‘No’ for although at present, there is much concern about the balance between young and old in society, and about the consequences of large-scale migration on the population there is one force that still binds all the elements into one unit – ‘a shared future’. ‘Mutual obligation’ and the concept of a shared future have underpinned the welfare state to date and will continue to do so into the foreseeable future.
This ‘shared future’ stems from our ideal of national identity. David Goodhart believes that although our society had for some centuries been essentially ‘an association of strangers’, we accept the choices it makes and the restrictions it imposes because we nevertheless share with each other a set of common values and assumptions. This is a view supported by Roger Scruton in his Civitas booklet ‘The Need for Nations’. (NB. However, some may argue that the huge immigration privately sanctioned by Labour in the 2000 coupled with the rise on Islam into our cultural mainstream – at the expense of Hinduism and Sikhism – are each destabilising).
Democracy is only possible if society as a whole accepts the ‘we’ mode of operation derived from assimilation into a shared culture and that therefore the ‘we’ consensus is destroyed by multi-culturalism. The conclusion is that the inevitable by-product of multi-culturalism is ‘me-ism’ (vested interests).
The ‘we’ that is presently being addressed here is a consensus for pensions and is against the competing jurisdiction of party politics and international organisations such as the World Bank, the IMF, the EU and UN which militate against finding our own uninterrupted solution.
In an attempt by Gov’t to look magnanimous and all-inclusive, while at the same time saving money in one area, a generation (the under 35s) had been burdened since the late 1990s with student debts. These long-term debts were predicted in this article to largely shut them out of any reasonable future expectation and/or ‘generous’ company pension schemes. Some question whether the social fabric can survive in a culture that burdens young workers with debt
So far, the solution to the perceived pensions crisis is to talk in terms of cash-strapped Gov’t, rising levels of taxation, longer work years and the need to save for one’s own welfare benefits. No one talks of planning for and managing the debt. The pensions deficit could be tackled in the same manner that a wartime economy could create and manage a National Debt. The decline in the money reserves used to back pension payments have gone without comment. The Table below shows the situation from 1989 to 1994 under the last Conservative administration.
Historically, the interest earned on the NIF balance appears paltry. And while contributions rose from £29 billion in 1989 to £35 billion in 1994 the ‘Opening Balances’ slumped from £10 billion to just over 3 billion (£3,577 in 1993-94). (This was before the New Labour administration of 1997). The interest earned on the NIF balance looked paltry as their contribution collapsed from £1 billion in 1988-90 to less than half that figure, i.e. £489 million. (One can only imagine that a similar slump is occurring now with near-Zero percent interest rates following the 2009 bank meltdown – RW). Despite a tiny opening balance of £3,577 million in 1993-94 (a period which saw business levels and housing prices decline) and very low interest returns the Total Receipts improved to £48 billion over £41bn in 1989-90.
a). National Insurance Fund (NIF) : Opening Balances (£m) 1989 – 1994. Tables 3.11 and Table 10.1 (ONS)

In the years from 1994 to 2000 the health of the Opening Balances had improved. However, the jump in NIF receipts of £25bn (from £48bn to £75bn), was not matched with expenditure on benefits paid to the unemployed or the sick. However, the above Table does demonstrate that given buoyant employment leading to healthy NIF contributions, even a modern era record-breaking lowly Opening Balance of £3.5 billion is no handicap to a government’s freedom of action. (A summary of the economy, John Major’s role, and the short recession of 1990-92 can be found in Appendix 2).
The payment of Benefits rose gradually from 1988 to 1994, £30 bn to £42 bn respectively, but by 2000 these had nearly doubled their 1988 level, namely to almost £51 bn with almost all sub-categories suffering a spending fall save for State retirement pensions which received a slight increase.
Unknown to the public at large the Treasury had been raiding the NIF to cover expenditure incurred by the 30 year along ‘Troubles’ in Ulster – for property repairs, rebuilding houses, shops, and hotel plus personal injury compensation claims. The extent of this can be seen in the figures, the much trumpeted ‘peace dividend.’ The winding down of military operations and compensation claims in Northern Ireland saw Treasury expenditure decline from £235 bn pa (in 1991) to only £40 bn (in 1994) – but curiously it then shot up again in 2000-01 to £230 bn (this could be linked to facts revealed later by John Major itemised in Appendix 2).
7. Statistics – Demography and Destiny
Societies constantly worry about their populations growing either too fast or too slowly. In the 1960s Paul Ehrlich’s alarmist international bestseller “Population Bomb” influenced (probably far too greatly), many individual couples’ choices and national policy formulators worldwide.
By 2005 some commentators were recognising that from the experience of economies in SE Asia that a growing population was actually a precursor for economic growth. [9] That China had grown into an economic giant despite its attempts to limit family size to one child has little to do with this. While it may appear at first sight to confound the above sentiment, it has more to do with China’s sheer pre-existing size of population, its pre-existing pent-up demand and its Gov’t new approach to its business policies.
Britain’s politicians will have to begin to seriously consider demography’s role in any debate about future pension policy, not only in crude numbers but the ethnicity composition given that pro rata the Asian sub-set is reproducing at a faster rate. (NB. Only now is this particular debate coming closer to being examined).
Demography has played a special role in particular places such as or Northern Ireland, where the changing population balance between Protestants and Catholics has loomed over the province’s politics and this should not be lost on mainland politicians.
At present, there is much concern about the balance between young and old in societies, and about the consequences of large-scale migration on population change. But we can speculate that with the ascendancy of a more family oriented Asian population there will be a greater degree of willingness to provide for the older generation. When population trends did manage to snag politician’s attention it was the low and still falling birth rate in the UK and all of the western world.
The question as to how people respond to attempts to influence the number of children they have remains technically unanswered, however, we have some guidance from CFS data (Completed Family Size, ONS). What can be inferred from China’s experience and from Paul Ehrlich et al contributions is that through politics cultural fertility changes can be affected when the economic pressures are strong. In the UK we have blurred indicators in the increasing Gov’t subsidies to make single mother households (SMHs) viable at tax-payers’ expense, while at the same time withdrawing the Married Man’s Allowances etc, resulting in a birth rate not of 2.4 but of 1.6 and 1.8 respectively. The CFS (ONS speke for ‘completed family size‘), is therefore at its lowest level in recorded history.
British Gov’t policy has to be viewed in the historical round to detect evidence of how good we have been at predicting population changes. What are the really interesting demographic trends that the experts are currently watching and are they watching more than one box ?
Below are 4 examples, in graph form, where Gov’t policy has directly impacted social behaviour.
Number of Marriages. England and Wales. 1961 – 1995 (000).
Source: ONS ‘Population Trends’, No 91, Table 22
 Against a background where transgressing social parameters began to be treated less severely the impact of ‘social’ legislation in the late 1960s, such as the Divorce Reform Act, abortion and state funding (via Legal Aid) for those bringing a divorce suit – but not for defending one – can be seen as resulting in a decline in the numbers marrying (previously marriage rates had only fallen in periods of economic hardship).
This would be of marginal interest were it not for the fact that married men are the wealth creators in any nation’s economy – and still are. In this vein, it is arguable that Britain’s economic decline would have been more severe had a whole raft of others countries not also adopted “no-fault” divorce in the years between 1969 and 1971.
During the same period shown in the above graph, i.e. 1961 to 1995 the number of live births outside marriage (i.e. illegitimate) dramatically increased (see Source: ONS ‘Population Trends’ No 92. Table 10, below).
Number of Live Births Outside Marriage, 1961 – 1995 (ONS)
 Births outside marriage have always occurred since records were first kept (at around the 5% mark). The mistake made in the 1970s and 1980s was to assume that the state could afford such practices and that it would have no detrimental or negative or cumulative impact on a society that was affluent on an unprecedented scale.
However, by the 1990s a degree of reality had dawned as the mounting costs to the Treasury could no longer be ignored and, no doubt with an eye on containment, the CSA was initiated. Meanwhile, legitimate births (births to spouses) had begun a steady decline.
Child Benefit and One Parent Benefit, et al 1970 – 1997 (£m) (ONS)
 The adjacent graph (Child Benefit & One Parent Benefit, 1970 – 1997) represents the millions of pounds paid out to the very many forms of Benefits; it includes Family Allowance. The annual amounts shown are not discounted for inflation, i.e. actual purchasing power. A graph in Jill Kirby’s booklet “Price of Parenthood”, page 2, (pub’d CPS) shows the cost after inflation for the years 1975 – 2001.
Its interesting to note that Denmark, France, Greece, the UK and Norway pay higher family allowances in respect of a child in a lone parent family (SMH) than to a child in another family type and that in the UK ‘benefits’ are paid only to mother as fathers are deemed not to be trusted with government money (only their own, presumably?). See “Child Benefit’ Research Paper 98/79” (29 JULY 1998), 97 op cit, Support for Children, pp 34-35 http://www.parliament.uk/Commons/lib/research/rp98/rp98-079.pdf.
From 1970 until the Finer Report of 1976 the graph shows the cost to the Treasury to be stable. After that year more benefits became payable only to the mother and not through the husband’s tax allowances. It is these small changes that overtime have an unforeseen cumulative effect.
The Table below displays numerically the Family Allowance element in millions of pounds in the early years (1970 – 1976) shown in the graph above and compares it with the huge amount paid in 1981.
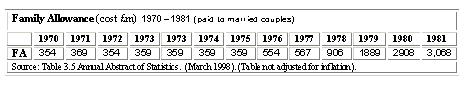 What is noticeable about the marriage and birth rate is not that both decline but that the government’s subsidy cost to each child actually doubles and then doubles again. Illegitimate births move from around 15% of all births to approx. 45% by the beginning of the 1990s.
In 1951 Family Allowances, paid by Gov’t totalled £67m pa. It was paid to just over 2.1m families and the number of ‘families with 2 children’ grew every year for 1946 to 1951 by approx. 100,000 per annum. The cost per child of Family Allowances to all sizes of family worked out at £21 per family pa. What is noteworthy is that the tax and fiscal regime of the 1950’s and 60’s saw an average married man with two children earning 105% of the ‘average industrial wages’ pay no income tax (source: “Freedom’s Children”, pub’d Demos, 1995). Today it is about 35%. In fact what is perennially ignored is that properly married and/or stable unions would not need anywhere near the same degree of state subsidies needed to sustain single mother households SMH (NB. But SMH have long been ‘fashionable’ in government circles and married and/or stable unions have not).
 The adjacent Table illustrates the lengths to which government will go to favour its favoured child. Between 1981 and 1993 pensioner poverty as measured by the lowest 20% of incomes was substantially reduced (from 16% to 11%). At the same time poverty actually increased on these measures for unmarried and divorced parents and this gained political traction which was later remedied in part. However, by far the most poor were married couples or those cohabiting couples living in stable relationships. Almost half (46%) were living on the lowest 20% of household incomes and this only slightly increased to 38% by 1993. Given that married and cohabiting couples far out-number unmarried and divorced parents this translates into a level of poverty that was widespread.
With the declining numbers marrying had come the rise in the numbers divorcing. This provides us with a most interesting observation relating to comparative wealth creation (which can, of course, then be taxed – see NIC Table below).
In the UK up to 160,000 couples get divorced in any one year. On average, each couple will have assets worth £165,000 that have to be split. The combined assets in the ensuing financial nightmare of splitting have been valued by ‘Moneyexpert.com’ at £26 billion in assets alone. [10] Often 90% of assets in any divorce move from the actual wealth creator to the mother and children in order to “provide for them”. This leaves the actual wealth creator with an uneconomic 10%. As Patricia Morgan wrote in “The Fragmenting Family: Does it Matter ?”:
- “With the collapse of family policy, the tax burden has been deposited on families, with those on lowest incomes or with one main earner the hardest.”
No. of Divorces 1961 – 2003 (GB and UK) (includes annulments)
 Japan was once one of the most dynamic economies in the world. But for some years now it had experienced zero growth and bank interest rates at 0% or 1% in an attempt to kick-start the economy (in 2005).
In common with the most successful economies in the immediate post-war years Japan enjoyed a high degree of social, marital and cultural stability
What is not so well-known is that Japan has had greater numbers divorcing than Britain, 290,000 in 2002, compared with 160,700 in Britain. (NB. how familiar this must now look in the Britain of 2015, i.e. zero growth in GDP terms, a huge national debt, and bank interest rates at 0% or 1%).
Not once did our media’s coverage of the Japanese economic dilemma hovered over the issue of divorce and its disruption to the wealth creation urge. This omission has been true of the coverage in the UK. Again, we can only speculate that Britain’s fall in the economic league table would have been sharper had it not been for other Westernised counties also adopting no-fault divorce.
Japan may well still be in the grip of stagnation in 2007 when new measures to allow ex-wives to claim half their husband’s pension come into force. According to Reuters, [11] this will hit the older retiring Japanese worker hardest as it is this sub-set of wives that are expected to form the fastest expanding category of wives seeking a divorce in the future.
Japan in common with other nations now had a static or declining population. In 2005, Japan’s population actually declined by 19,000. How Japan, or any of the 59% of nations with below population-replacement birth rates – and which represent 44% of world population – sets about creating the baby boom needed for economic resurgence is problematical ?
Japan is increasingly dependant on being populated by Koreans to maintain its economic powerhouse image in much the same way that the primary source of population growth in the future for England will be Muslim.
In a stagnant society, i.e. one that has zero or close to zero growth, with more female children tend to be born than male children. In a growing society, the gender ratios are reversed, i.e. more boys tend to be born than girls. In a stagnant society 1% – 4% more girls will be born, and in a growing society usually there are 2% – 4% more boys born. (NB. France now has a 51% female population). The gap widens still further at child-bearing ages as women in a stagnant society are more likely to survive.
Britain in 1951 saw 410,000 boy births and 387,000 girls born and there were 38,000 (4.8%) illegitimate births. The numbers and percentages may seem small, but they are really large in subsequent impact terms (as in compound interest). It has direct implications for wealth creation, the number of uninterrupted years given over to wealth creation, the amount of ‘tax take’ and the amount paid into the Exchequer by way of NIC contributions (men pay in more per capita).
A growing society is an attraction in itself. A stagnant society sees the younger ones run and there is some evidence to show there is currently White Flight from the UK among the middle-aged and lower middle class.
8. Women’s pensions – what scandal ?
The received wisdom is that women’s pensions are a “national scandal”. [12] So concerned was Alan Johnson, the Work and Pensions Secretary that he recently said he was considering moves to introduce a “citizen’s pension”, similar to that found in New Zealand. This would ensure that 100% of women were paid the same benefit as men no matter how little they had worked. Such a change might have to be premised on the number of years a person was “resident” not on how much they had contributed to the National Insurance Fund. With the allure of Britain as one of the preferred destination among immigrants then the shallower qualifications of ‘residence’ could have severe implications.
Government and media have been quick to point out that only 50% of women get the full basic state pension but are expected to be carers, both in their middle years and in their retirement. But the Secretary forgets that not 100% of men are paid the full pension (and when men do take a break to care for a family members they are not compensated as highly as women in the pension regime, e.g. Home Responsibilities Protection or HRP).
Help the Aged made a valid point when it states that for too long the pension system had reflected a man’s world of work and the family arrangements of half a century ago. Given the feminist ‘career culture’ foisted onto the younger generation of women it could be a problems that resolves itself in the next 30 years (marriages deferred and/or decline) as more women adopt male styles of working patterns.
In actual fact both these issues have already been tackled. The Home Responsibility Payments (HRP) scheme applies during child rearing years. Women receive 100% NIC credits as if they had been in full-time paid work (HRP does not do this for men who raise children; men receive only a 70% contribution towards their NIC). Arguably this makes women better off than men who might face redundancy in their middle years and then face the prospect of larger gaps in their NIC record.
In retirement women can be paid ‘care allowances’ and benefits when they and or their husbands are over retirement age. The assertion, therefore, that women, who work for fewer years in order to raise children, form the majority of the poorest pensioners, is not entirely true.
Currently, in the UK, the state pension is based on contributions paid into the National Insurance Fund (44 years for men and 40 years for women). Given the recent (preceding 2005) increase in male work disruption, structural unemployment and the disappearance of 40-hours a week ‘contracts of employment’, the prospect for all men making a full 44 years of contributions is today far bleaker.
Parliamentary committees have been told that 83% of retired women have an income of less than £1,000 a month compared with 58% of men. What they were not told is that the majority (over 55%) of pensioners are women and that of those born in 1925, i.e. aged over 80, more than 75% are women and would have missed 6 years of contribution prior to 1944.
In political terms, it is almost a non-event that 40% of men also do not have an income of £1,000 a month, presumably after having worked most of their lives. This is more important in economic and political planning given the forsaken gain to the nation of having men, fully employed and paying tax for over 40 years. In the lowest decile of income, ie the lowest 10% income band, are not pensioners but working married couples with children who would be pleased to be in receipt of £1,000 p.m (see Quintile Table above).
Figures from the Department for Work and Pensions show that the average state pension paid to men (in 2005) was £75.33 a week (£301 p/m). With the state ‘second pension’ or its predecessor SERP, this increased to £105.40, i.e. £421 p/m (barring, of course, any of the state’s insistence of pension spitting, 50/50, due to divorce). For women, the average weekly state pension payment was £54.74 rising to £66.76 (all these rates may vary depending whether married or single, and whether claiming Pension Tax Credits).
However, there is a fundamental difference between income and wealth that is worth emphasising in the perplexing debate about pensions. Women may earn slightly less than men but in terms of ownership and control of wealth they are richer. Men, who die earlier, leave their spouse the proceeds of for instance life policies, investments, a pension that is still paid after his death and a house with a fully paid mortgage. Few people realise that in England & Wales over 50% of all fully paid mortgages are not jointly owned but owned by women, i.e. widows.
To pay for the proposed Citizen’s Pension, championed by the Liberal Democrats as well as the National Association of Pension Funds and the Pensions Policy Institute, it might be necessary increase the state pension age to 67, or to simplify (better reward ?) tax relief on private pensions. But the unanswered questions remains:
- “Who wants to work when they are 67 ? And which employer is prepared to employ someone aged 63 for 5 years ? How will manual workers be expected to compete for employment with younger, fitter men ?
9. New Zealand’s “citizen’s pension”
New Zealand’s “citizen’s pension”, cited by Mr Johnson is based on a flat-rate payment equivalent to about £89.19 a week. It is paid to all people aged 65 or over – as long as they have been resident for ten years. This is said to have had the effect of boosting the income of elderly women and has meant that only 5% of pensioners live in poverty, compared with about 20% in Britain.
However, it should be pointed out that the entire population of New Zealand is only 4.4 million and its raft of ‘social’ reforms begun a decade ago has resulted in the sell off its entire Air Force and half its navy. It is now reliant on Australia for its territorial defence. (NB. ironically the new British Coalition government of 2010 was also forced to slash military spending to make good the deficit it inherited).
 The graph (right) shows a comparison between the UK and New Zealand’s state pensions. The ability to pay a pension is worked out on the Net Present Value of an income stream, i.e. how much money do you have to put into a savings account to give you a given weekly income. This sum is the value of a given pension on the open market.
The table below lists the life expectancy and cost of pensions paid to each sex. After retiring at 65 men can expect to live a further 10 years and in that time be paid a pension of £75 per week. While women can expect a lower pension they, on the other hand, live longer lives and cost the NIF £59,000 as opposed to only£42,000 for men.
 If one does the calculation using 5% as the annual interest rate, then the value of the male pension to 76 (the average life expectancy) is just over £36,000. A rough rule of thumb current in the USA, is that for every $1 saved into a pension scheme the return is a little over 60 cents. From this we can surmise that in the UK pension funders, i.e. mainly men, will not only pay in more due to uninterrupted work patterns, but receive less due to their shorter life expectancy. The ‘surplus’ they leave is, or can be, then used to fund women’s pensions.
In contrast the value of the female pension to age 81 is about £38,500. The difference is therefore only about £2,500. In fact, the difference between the two is less than one year’s pension – well within the margin of error for life expectancy estimates. If the female retirement age is moved to 65 (as planned) then the value of the female pension reduces to £32,300 and notionally men get £3,700 more. (NB. The overall winner in this is the government TReasury. Even without the move to age 65 for women the government has always made a profit from weekly National Insurance Contributions and deferring women’s pension to 65, or older, will yield a yearly windfall of many millions of pounds for the next 10 years. An example of profitability is the number of extraneous spending government undertakes using NIF but which are not connected with NIF affairs.).
With the labour market fast approaching 50/50 in terms of gender participation and pay but with women still working 10 hours a week less than men it may be opportune for young women to consider funding their own gender-exclusive benefit fund.
10. Who Funds Pensions ?
The amount paid in by each sex is shown in the Table below. In the early 1990s when the total work force numbered about 25 million, men paid in just under 60% of all contributions to the National Insurance Fund and died after drawing their pensions for 10 years.
 But by 2005 women represented 45% of all those working in the labour market – far higher even than during World War II.
The adverse effects of male unemployment (resulting in lower income “tax take” and NIC payments) are set out in the Table (shown left). Consistently, since 1991, men have been unemployed at greater than 3 times the female number (e,g. in 1996, 667k v 267k at the 28 week level, and 663k v 137k at the 52 week level). At the same time men have historically shouldered most of the burden in funding the NHS and pension for those already retired, through their NIC payments, as shown in the Table (below right).
 During certain periods, post 1945 and again in the 1990s, strenuous and costly efforts have been made by Gov’t to entice more women back into the labour market. These efforts have been justified, in part, by alluding to the extensive and key role played by women during wartime need. However, an examination of the statistics reveals a completely different picture.
In 1938 there were 15.5 million people in “insured employment” (11.4m men and 4.1m women). The total female workforce increased only marginally to 5m during the war years while the male workforce totalled 16m, of whom some 12m were in “insured employment” (so still above 1938 levels). In the immediate post war period e.g. 1948 the total workforce had increased to had increased to 20.7m (from the pre-war time figure of 15.5m), of which 14.7 m were men and 6.9m were women. Contrary to urban (feminist) myth, it was only after the war that permanent female participation in the labour force grew – it was higher in 1948 then in 1943. In 1948 there were over 6m women in the labour market compared with only 5.7m in 1943 (the wartime zenith) and 4.1m in 1938. The change / difference in female employment was between 1938 and 1948 with the collapse of (uninsured) domestic service. In pre- war Britain women had been one of the biggest employers of other women.
Contrary to another urban myth, namely that women had to give up their well-paid jobs and hand them over to returning servicemen, but, after being “demob-ed” less not more men were employed than in wartime years (Annual Abstract of Unemployment and Employment Gazette). Certain sectors, such as the railway, did see women surrender their jobs to allow men from the armed forces to resume their original jobs.
Historically, it was customary for females to have only paid in to the NIF until such time as they were married, and if they worked after they married they only contributed a fraction of what was needed to fund their pension. They, and Gov’t, have relied on their husbands dying prematurely and being paid their pension from his life-long contributions.
If anything the situation today is much worse than two generations ago; there are one million missing men. Experts state that today men are 3 times more likely to die than women in their late 30s than compared with their fathers (parents) when the chances then were equal. [13]
Far from the Treasury adding via general taxation to the NIF as the Beveridge Plan envisaged, some commentators accuse the Treasury of treating the NIF as a piggy bank to raid in order to fund pet projects (and Gov’t initiatives that more properly should be paid for out of general taxation).
11. Pensioner Dependency Ratio
And here we, at last, get to the nitty-gritty of the pensions panic – the Pensioner Dependency Ratio. The moral panic of 2005 regarding pensions both here and overseas, particularly in the US and probably to some extent in the EU, was based on population predictions 30 and 50 years into the future, plus the fact that many European pension funds were already over-spent, or close to that point was a sign of gross mismanagement, not systemic failure.
What Nigel Lawson failed to communicate adequately when Chancellor was that although expenditure on SERPS is likely to peak in 2030 it was projected to decline in the years thereafter. By focusing on projections for 2030, a sense of impending crisis has overwhelmed Whitehall and consequently the media, and this was allowed to influence the public’s perceptions of what was going on.
Neglected has been the trend from 1900 to 2000 when the number of people of working age for each person over state pension age fell from 14:1 to 3.5:1. (The system coped with it every step of the way). By 2040 this ratio is projected to fall to 2.5:1. The projected decline in this age-based support ratio is not only less steep than recent history but it should have come as no surprise. If wages/incomes are allowed to increase in their natural way then this will increase NIC and the “tax take” that today’s calculations have not reflected. The “tax take” will also increase with consumer prices, VAT, rises in house prices, petrol prices, stamp duty, car tax, and more frequently having to pay items such as capital gains.
The Spring 2004 edition of ‘Population Trends‘ (page 11, Table 4) shows the ratio between those of working age (16 – 65) and those of pensionable age (over 65). The ratio is constant from 1981 to 2002 at approx. 3:1 (36m v 10m 2002). In 2026 this is expected to be 39m v 13m and by 2031 38m v 15m (33% and 40% respectively).
 Much has been written recently about the widening ratio between young workers and OAPs (old age pensioners) but as we saw earlier the rate of increase after 2012 will only be 100,000 pa over normal new pensioner growth (the boom years of 1945 to 1951 simply carried forward). But how accurate are such dire pension predictions likely to be ?
The Baby Boom generation will begin receiving pensions in 2012, and for women in 2007. Men, who live 10 to 12 years after retirement will cease to be an extraordinary drain on the NIF by 2022 – well short of the ‘difficult’ year for government thought to be from 2038 or 2050. Women, who will live, say 25 years after retirement will cease to be an extraordinary drain on the NIF by 2032. So between 2012 and 2022 the demand on the NIF should have almost halved and by 2032 when most women will have come to the end of their lives (aged 85), it should have reduced by close to another half (a function of death tapering-off the numbers surviving).
The changes to pension entitlement for women (after the European ruling) altering it from age 60 to 65, will be phased in from 2010 to 2020 AD. Between those years there will be a transition period during which the overall number of Old Age Pensioners (OAP) – mostly women – had been forecast to rise, in 1992, from 10.6 million to 11.9 million by 2010, and then to 16.8 million in 2038. However, instead of 16.8 million people being paid pensions in the year 2038 the forecast is for only 15.2 million.
Without the pension qualifying age being altered for women from 60 to 65 (announced in 1993), there would be an estimated 19m pensioners to finance by 2060. But with the delayed payment age in place, effective from 2010, the peak will only be 15m pensioners in 2031. Thereafter it will taper off.
This represents a huge saving to Gov’t in the order of billions of pounds (£ X bn). every year. A rough calculation shows that Gov’t saving is the result of the number of pensioners NOT paid, i.e. almost 2 million, multiplied by the current pension rate, i.e. £59 p/w x 52 wks x 2m OAP = £6,136,000,000 p.a (£6.1 bn).
The benefits to Gov’t of this change are both front and back-loaded. The front-loading advantage is the deferment during the transition period and the back-loading is in the fewer number of years a female pensioner surviving to claim, i.e. an estimated 5 years less than historically.
The worst case scenario at present seems to revolve around figures for the years 2020 and 2038. In the 1990s Population Trends (ONS) published the following ratios under the heading ‘Pensioner Dependency Ratio’. They allowed for a margin of error and hence there is ‘adjusted’ and ‘unadjusted’ columns.
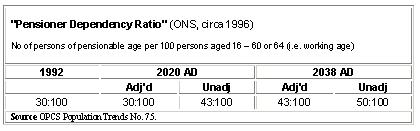 It is clear that the Pensioner Dependency Ratio indicates the number of working people required to finance the elderly but this is to accept the unsophisticated nature of present day criteria. (NB. Since 2005 Britain has witnessed a huge influx of migrant workers – many single, and some destined to return to, say, Portugal or Poland, as they reach a mature age).
Predictions of a crisis in state pension schemes due to the baby boom generation ignores rising productivity (Mullan, 2000):
- “On present trends the worker in 2041 will be the equivalent of more than two workers today” (Catalyst 2002: 10).
This will mean modest improvements in state pensions are immediately affordable without increasing contributions because of the NIF surplus. No regard has been given to the increasing amount of work that will be done by robots and the assumption is that only living human beings will be taxed in order to fund pensions.
At present tax allowance by way of capital equipment (in 2005) are granted to robotic equipment but 30 or 50 years hence as they increasingly replace human labour will it be found appropriate to tax robots as if they were human labourers ? Or would such a move become a modern-day version of the “Window Tax” (1696 – 1851) ?
Whatever the outcome to the above question it is clear from other studies that the proportion of pensionable persons in the UK will undeniably increase leaving the ability and methodology to fund them as the only contentious matters.
The ONS predictions for the UK population as a whole (and as at 2005), while falling in the medium term sees a rise thereafter, i.e. in the years 2040 to 2060. It could be argued that the present pensions crisis is merely a trough in what is a cyclical and self-righting mechanism. (NB. we now know that the UK population has expanded sharply in the intervening years).
In a diagram reminiscent of rock strata Fig 4 in ‘Population Trends’ No 115 (Spring 2004 Ed, page 11). shows various age groupings from the years 1981 to 2071.
 The age groups are 0-14, 15-29, 30-44, 45-59, 60-79 and 75 and over. This gives the effect of their percentage of the total population. All of the horizontal bands except for 2 (the 15-29 and 30-44 groups) are constant in their proportion. At no pint do the over 60s exceed 50%, though we should be aware of a slight trend among working women of dying earlier than was the norm.
Between 1981 and 2001 the numbers in the age groups 15-29 and 30-44 fell from around 60% to 50%.
Those in the age group 0-14 fell only from 20% to 15% of the population. By the time the scale gets to 2071 the number of people in the over-75 category has risen only slightly.
Many commentators see current (2005 era) family policies as influencing the fall in the birth-rate and giving rise to the fall in the number of children in the 0-14 year old age group. This can, through tried and tested measures, be easily remedied. (NB. In the years following 2005 many local authorities planned the closing of many of their schools as pupil numbers fell but in recent years, post 2010, these schools have been reprieved and some expanded as more pupil places are demanded. This can only mean an upswing in births from 2005 onwards).
It is of interest to record that the first generation to enter the British state pension scheme in 1948 gained higher returns on their contributions than were available for later cohorts. All subsequent cohorts are projected to roughly break even in terms of net transfers (Hills 1995).
 In this manner equilibrium was achieved in which each generation paid into the NIF as workers and received a fair return in their retirement. However, the policy of cutting state pensions since 1980 has disturbed this equilibrium. On current policy, the next generation to retire will probably receive less than they contributed (Hills 1995: 61).
Finally, the graph (right) shows that the expected level of births (as of 2005) was expected to have more or less flat-lined, or be slightly undulating at best. However, the projected trend line for deaths (a far more predictable development) on the other hand shows a substantial increase up to 2051. Therefore, one can assume that any shortfall in tax/NIF receipts would be short-lived and easily funded from the NIF reserves or Gov’t borrowing. One could go further and speculate that only in the 1971 era, when births matched deaths, was the scene set for the panic over pension provisions which gripped government 30 years later. (NB. this was, of course, long before any one knew in 2010 that the government had spent all the money and reserves). Deaths may exceed births after 20131 but children do no pay taxes so the weight of funding pensions will not be shared by them until about 2051 when the number of pensioners has almost peaked (and while parents are still active in the labour market), and death decreases pensioner numbers in absolute terms. (NB. these “projected figures” are prior to the mass immigration of the 2000 being made public so the number of working young and their children are not included).
12. The Pension Panic
In an invigorating reassessment of the problems caused by global over-population Sheldon Richman, Senior Editor of the American Cato Institute asserted in 1995, that there is no over-population problem. Population growth is simply the result of the plunging death rate and an increasing life expectancy worldwide. That, he says, is human progress and ought to be acknowledged as such.
The moral panic that the growth in human population would not be met by increases in the production of food and other resources, including energy have proved illusory. Doomsday has not arrived. Famine in the 20th century was an eco-political issue rather than an actual ecological phenomenon. As he points out we are not running out of resources and the real prices of raw materials are lower than ever before. Only the price of labour has consistently rises.
Between 1776 and 1975, while the world’s population increased six-fold, real gross world product rose about 80-fold. People are net resource producers. Population growth and economic growth have therefore been shown to be compatible.
The fashionable claims by catastrophists that over-population (a population explosion) will cause famines, poverty, disease, and environmental degradation founder on the single undeniable fact that the global death rate has plunged. All over the world, people are living longer.
This means that all countries will have to face future times when their ratio of workers to pensioners is higher than at any other time but it also means that with cyclical patterns of population growth this phenomenon is not new and has been met and overcome before many times. Countries need to take a less defensive attitude to pensions. Pensions can prove to be an instrument for restoring consumer confidence, or, they can be the catalyst for governments to dither and do nothing.
We need to utilise lateral thinking; we need to realise in Sheldon Richman’s words that the entire world’s population, when standing, could fit inside Jacksonville (Florida) city limits with the rest of the world given over to wilderness and wild animals. Dense cities are often surrounded by nearly empty countryside. Or put another way all the world’s population could fit inside the state of Texas with land and a home for everyone.
So when there is talk of too many pensioners we need to remind ourselves of what we mean by “over” in the phrase over-population ? The prefix “over” implies a standard. For example, “overweight” implies a standard linked to height. But by what standard is the earth over-populated and by what standard are there too many pensioners ?
For over-population to be real there must be conditions that are undesirable and unmistakably caused by the presence of a certain number of people. If such indications cannot be found, we are entitled to dismiss the claim of over-population. Similarly with pensioners. What conditions are there that make their number undesirable and unmistakably a cause by the presence of a certain number of pensioners.
The Socialist Worker under the headline “Pensions: The plan to steal £100 billion” puts it this way http://socialistworker.co.uk/art/5373/Pensions%3A+The+plan+to+steal+%C2%A3100+billion :
- “The government tells us we are living too long. What ought to be a cause for celebration has, it seems, become a problem because we are getting too much in pensions.
- Chancellor Gordon Brown wants us to work longer. He knows from the statistics that this means we [blue-collar workers] will die sooner [than white-collar workers].
- But he also knows that pensions have been robbed in the past. So now he is proposing the biggest single [robbery] on working class living standards since the 1930s.”
- “What is the difference between a woman of 55 and a woman of 49? The 49-year-old woman will get £20,000 less. She will have to work to 65 to get her basic state pension, not 60. That is five years at £79.60 a week she won’t get.”
How the Socialist Worker arrives at the £100 billion is straightforward. They assume there are about 5 million workers in the public sector alone and they are all obliged to work an extra five years. Each person will lose 5 years of occupational pensions worth around £4,000 a year times 5 years equals £20,000. Multiply that by 5 million and you get an incredible £100 billion switched from workers to the state. But what the the Socialist Worker does not include in their profit for government is the extra economic activity induced (exports imports), attracting VAT, and the additional tax take from worker’s incomes who continue in employment. Even if only 50% of that number manage a further 3 years of employment before being forced to retire the government still wins out.
The Socialist Worker points out a ‘technical’ point about wages, namely that:
- “Pensions are basically deferred wages. New Labour wants to cut public sector pensions by around a third.”
At present 5% of Britain’s Gross Domestic Product (GDP) goes on pensions. The government’s official statistics say that even in 2050 this will only be 5.7%. This is nowhere near a crisis, especially when the predicted NIF is examined for that year.
13. Bursting the Bubble – and into the future
The consensus is that pensions are a huge burden on the nation’s taxation structure (actually, since pensions are deferred wages, its only giving back to people their own money). The orthodox view is that this burden will increase as people begin to live longer and that the present 5% of Britain’s Gross Domestic Product (GDP) spent on pensions is about the most that any country can comfortably afford before Gov’t has to reach for ‘selected’, i.e. means-tested, measures.
But we have been here before. In 1952, means-tested top-ups were already needed for 856,000 pensioner households. Means-tested National Assistance always played a much bigger role in the post-war welfare state than Beveridge and the Attlee Government ever envisaged.
Proposing that individual workers should separately set aside 4% of their income for future pensions is simply another way of saying that NIC should be increased by 4%. However, Labour’s pledge not to increase NIC put them in something of a straitjacket.
The extra 1% NI contributions introduced by Labour in 2003 to provide money for the National Health Service had the effect of reducing by about £1 billion a year the amount of contributions paid into the NI Fund. The priority for that money should have been pensions first and health second – but this is yet another example of Gov’t raiding its handy and rather well stocked piggy-bank. The Treasury appears to regard NI contributions as a convenient and efficient form of taxation. [14] The size of the NI Fund’s balance, therefore, is not taken into account in deciding whether or by how much, pensions should be increased. In recent years several technical changes (charges, transfers, grants, compensation, swaps etc), have been made to the presentation of the fund with benefits (including pensions) seen as part of total public expenditure. [15]
A so-called series of “green” taxes whereby employers are compensated by having their NI contributions reduced is costing the Fund about £2.4 billion a year, when the proceeds from the green taxes amount to only about £1.8 billion. This is another scandal of either incompetence or thievery by the Treasury on a par with the SERPS fiasco.
In the same way that Labour achieved political kudos for giving the Bank of England control of the interest rates the next Conservative Gov’t should perhaps consider handing Control of the NI Fund to a National Insurance Commission. Such a Commission could consist of representatives of contributors and pensioners, as recommended in a Catalyst Forum paper in 2003, together with lay members of small companies (chambers of commerce) and trade unions (trades council).
The countervailing view is that the sustainability of state pensions in the UK, under current policy is assured. This is a view shared by Dr. Madsen Pirie of the Adam Smith Institute at a lecture given at Cheltenham Ladies’ College, in July 1996, and confirmed more recently in a New Statesman article of May 21st 2001. [16] His speech at Cheltenham Ladies’ College also entertained the idea of individual ‘pension pots’ for individual tax-payers – no doubt with incentives. But, of course, this would mean that men’s pensions would be richer and fuller than most women’s.
Far from the NIF being depleted and capable of providing only, in Michael Portillo’s words, a ‘nugatory’ pension, the National Insurance Fund (NIF) is predicted to swell in coming years and will show an incredible working surplus of £3,541 bn by the year 2060 (£3.5 thousand, thousand million). This also assumes NI contributions are not reduced.
What a far cry this was from the meagre £3bn of 1993 ! Or even the short-term predictions of disaster emanating from doom-monger in 2002 – 2005. The position was underlined by the parliamentary Report on the Contributory Principle [17] which stated:
- “We have concluded that, unless there is a significant change of policy, there is likely to be a growing surplus in the National Insurance Fund as a result of benefits being linked to prices, and contribution income, based on earnings rising at a faster rate.”
And their survey of the history of National Insurance since Beveridge:
- “ … led them to conclude that the National Insurance scheme has been undermined, both directly as a result of successive Governments’ policies and indirectly as a result of economic and social change.” (Paragraph 32)
The report also found that there was:
- “ … a fundamental distinction in origin and purpose between benefits which people have earned on the basis of their contributions to cover identified risks, [pensions] and benefits paid by the state to people on low incomes.” (Paragraph 72).
This last remark may allude to the shift in the 1970s to the payment of benefits premised solely on a ‘needs’ basis rather than the original contributory one.
The reason for this immense growth is simple; while workers have been paying a percentage of their rising earnings into the Fund, benefits are indexed only to prices (the cumulative effect mentioned earlier in this paper of interest and the 2% to 4% disparity between prices and wages).
Already the resulting surplus in the Fund grew as at December 1999 from nearly £14bn to £23.6bn in 2002. This is equivalent to 43% of all social security payments (Gov’t Actuary Dept, GAD, 2003).
The combined employer / employee NI contribution is currently 19% of the employee’s earnings. However, the same current policy envisaged Pay-As-You-Go (PAYG) spending on pensions to fall to only 15% by 2050. This assumes a 2% annual real earnings growth, but if earnings growth is only 1.5% PAYG spending will be 17% (GAD, 2003). Depressing wages – as happened in the Major years and again today (2010- 15) – will adversely affect this outcome.
Given the growing number of pensioners in the coming decades, state pension spending per pensioner by 2050, relative to GDP, will be close to half (only 58%) of the 2000 level (ref. DSS 1998: 14). So under that pessimistic mantra the direction would see today’s workers pay less and receive increasingly inadequate state pensions rather than facing an ‘intolerable burden’ of NI contributions, i.e. but giving them an adequate pension.
This gives rise to an opportunity whereby today’s workers will in future choose to pay the same or slightly more but receive an increasingly adequate state pension.
Suggestions that NIC might have to rise to over 30% of income have sparked un-informed panic in some quarters. The reality of it is that by 2060 naturally occurring wage increases will have lifted the amount collected by the NIF to levels far in excess of today’s totals. (NB. See the billions quoted in previous sections, but if both interest and wage rates are suppressed – as they currently are – this path is jeopardised unless they are free to bounce back. One suspects that the self-correcting mechanisms, after 10 years of oppression, will be violent when they come).
But even assuming employee and employer shares of NIC contributions remain roughly equal and that naturally occurring wage increases do not occur, an increase for employees from a 10% contribution to one of 15% over 60 years is hardly a work disincentive. The concomitant increase by 10% over 50 years for the employer’s contribution, giving a combined total of 31% in 2060 (ref. GAD 2000), would be equally lacking in deterrent power.
For although on paper this would appear to represent a substantial rise in contributions, it does not mean workers in 2060 would be worse off than workers in 2000. The Government Actuary Dept (GAD) commented that due to expected real earnings growth:
- ‘Even with higher contribution rates real net income [of workers] would still be significantly higher in 2060 than it is now’ (GAD 2000: 23).
The following Table summarises the cardinal differences envisaged between 2000 and 2050.
 When itemised the most significant item in the adjacent Table was the projected NIF reserves – up from £24 bn to an incredible £3,541 bn by 2050 (though this does not state whether the effects of inflation (if there is any) had been taken into consideration. Every other item indicates a cut, e.g. NIC down to 15%, or an increase in costs, e.g. income support up to 2.6%, or an increase in the pensioner ratio e.g. 2.5:1 by 2050. It all adds up to less for more people, e.g. 20% for the basic plus State Second Pension which is down in concrete numbers too, e.g. £26 bn. (NB. Again it has to be emphasised that this was some years before the banking incompetence of 2008-09).
When the Old Age Pension Bill was passed in 1908 it represented approx. 25% of earnings. By the time of the defeat of Harold Wilson and the arrival of Mrs Thatcher it was just over 23%. Under the seven years’ tenure of Tony Blair, it had fallen from just over 17% to under 15% as of 2005. A more recent forecast by the Treasury is that the basic state pension will dwindle to no more than 7% of average earnings by 2050 (see Table above).
One commentator, Graham Searjeant, viewed the Adair Turner Report as little more than a stealthy nationalisation of the pensions industry. But it could also be viewed as a legitimisation of Gordon Brown ‘stealth tax’ policies by institutionalising them.
The fear is that without abolishing the present pensions tangle we risk plunging into an even greater tangle. And far from encouraging private provision, it would squeeze them out. Turner’s compulsion would not promote mass voluntary saving – instead of increasing pensions, over time, the majority who already save would also inevitably be left with less.
Surprisingly Pirie agrees with Searjeant, stating that:
- “The state should provide a basic pension from taxes, big enough to live on. Employers and pension companies could deliver anything above that.”
Both of them see the opt-out rules of the Tory era and means-testing of the 1930s and 1950s, as unnecessary complications. In an ideal world, if the state provided a basic unembellished spartan pension, i.e. more than sufficient for basic needs, people could add to that by lifetime savings accounts (which some call Fortune Accounts).
If people saved about 12% -14% of their salary over the years, with the funds invested and managed for them by competing providers, the ‘pensions problem’ would no longer exist for most people. The tax rules could also be greatly simplified. Tax deductions, benefits and exemptions for policies, well-known 30 years ago, e.g. mortgage relief, married man’s allowance etc, could be re-examined and resurrected.
With no tax on any growth in the fund, capital gains forsaken, and none when money is withdrawn as pension income (NB. which is similar to the April 2006 changes) there could well be a resurgence in the pensions and savings industry. (NB. There is more than a hint here too of the 2014 and 15 Budget when pension pot restrictions were lifted).
To get the Treasury to acquiesce would probably require that pension contributions be made out of taxed rather than untaxed income, but a smart Treasury would allow the latter.
The consequences for an obstinate Treasury would be that fewer people retiring would have access to income other than that provided by the state. To lessen their burden the Treasury would do well to encourage the shift to private pensions. To do otherwise would mean the bulk of their resources and or policies might be absorbed in dealing with a never-ending series of top up scheme and Gordon Brown inspired ‘tax credits’ calamities.
Another advantage to a ‘smart’ Treasury would be that the more private pension were held then the more of their property (assets, cash etc) would pass on to their heirs when they died (NB. given the current equity and housing market buoyancy, in 2005). This could then either be taxed or allowed to form a better start in life for the next generation who, in turn, could more easily afford bigger private pensions, pay of student debt, or invest for wealth creation purposes. (NB. The opposite has happened due to the banking collapse, and reluctance to lend by banks – not that there the slightest reluctance to lend by Gov’t to banks. Mature children are today more often to be found living with their parents or waiting to inherit rather than purchase a starter home; a situation repeated in Japan).
If these steps were taken the Treasury would probably continue to reduce its need to have huge funds to meet any future pension’s crisis. Of course, the state will still need to make payments into the pension funds on behalf of those who cannot do so for themselves (the unemployed, disabled, etc). For those on modest wages, or with career breaks and/or with periods of part-time work, the money saved through a private pension may well be wasted, as declining state pensions make it impossible to avoid means testing It is this sub-set that the Treasury could minimise.
But with full employment most people will earn enough during their working lives to provide for a comfortable retirement. By allowing the value of private pension to pass to the next generation further relieves the pressure on future taxpayer’s goodwill who have to fully fund state pensions until the claimant’s death.
During a previous general election the Labour Party promised, “to ensure that all pensioners . . . share fairly in the increasing prosperity of the nation” by restoring the earnings link.
This has failed to happen and instead we have had a succession of time-buying reports. That UK state pensions are financially sustainable is widely acknowledged both nationally and internationally. But the government’s complacency and incompetence led to a growing clamour for improved state pensions to prevent ‘pensioner poverty’ and reduce general income inequalities. If thy could have shown themselves to be fairly treating those workers who paid their NIC, all negativity and doubts would have vanished.
A good pension scheme is important for many workers – 40% of NHS staff recently surveyed said that their pension was a key reason for staying in the job. Attacks on pensions could increase staff shortages in these essential services. New Labour issued a Green Paper proposing further change to be implemented in 2008. It suggested reducing pensionable pay by taking overtime and weekend pay out of calculations, abolishing final salary schemes and increasing worker contributions without any significantly improved benefit. Such a course would be an attack on their core voters which could be politically exploited. (NB. But since they shown themselves to be unreliable in husbanding the nation’s monetary reserves one has to assume the same level of nativity in pension matters).
Retiring at 60 on a ‘decent pension’ is not a luxury for workers; a study of 12,000 people by the International Centre for Health and Society at University College London showed that postal workers, hospital porters and admin. workers were far more likely to suffer heart disease and mental health problems than those vocations we consider as “professions”. Any hint at a two-tier state pension system would disproportionately and adversely affect these, the lowly paid.
According to a recent report by the Faculty and Institute of Actuaries, people on pensions of less than £4,500 a year are twice as likely to die early than those getting more than £13,000. Brian Wilson, the chairman of the research working party, said:
- “A key factor for living longer appears to be the level of income individuals receive in retirement.”
The state pension upon which 42% of pensioners are entirely reliant, has been allowed to wither by successive governments, both Tory and Labour. It is now less than 16% of average earnings, down from 23% in 1979. People with occupational pensions are not hugely better off than those on the basic state pension. The average occupational pension pays out only £4,000 a year.
Britain is almost unique amongst OECD countries in not having a system to protect workers’ pensions in the event of business failure or premature closure. Indeed, the compensation levels for those made redundant are fixed at 1960 levels; thus a man made redundant after, say, 30 years service will receive only £4,000 under the mandatory minimum state scheme.
Recent legislation to provide compensation (the Pensions Protection Fund, PPF, launched in 2005) is rightly considered to be too late for many and inadequately funded. America has for a long time had a ‘lifeboat’ for pensions, i.e. the Pension Benefit Guaranty Corporation.[18] The lack of legal restraint on companies wishing to cut back their occupational pension schemes in the UK and the US has been only belatedly been recognised as a problem. There are serious doubts about the way that US system is working.
The UK’s new Pensions Protection Fund was set to be launched in 2005, whereby all British employers offering final-salary pensions must pay premiums to insure those benefits. When a company fails, the PPF will take over the pension scheme, paying out most or all of promised pensions up to a capped level. (NB. However, if a company does not have, or no longer has, a final-salary pension scheme this additional cost, paperwork and bureaucracy is avoided.
A baby boy who was born in 1900 could expect to live to 56 – and the ‘average’ worker died at 48 years of age. It wasn’t therefore a hugely generous step for prime minister Lloyd George to introduce the first pensions for people but limit it to those aged over 70 (Bismarck did a similar thing in Germany. In 1899 Germany introduced old age social security but payable only to those aged 70). People today are a little too smart to be taken in this way.
In retrospect, it should come as no surprise that personal pensions reform in the 1990s became controversial. The pension and insurance industry – which stood to befit most from their creation – was highly influential in crafting their design. At the time Norman Fowler MP is said to have relied heavily on a small group that included the highly influential insurance executive Sir Mark Weinberg, who had launched three insurance companies. According to Fowler’s former aides, no one influenced Fowler more than Weinberg; one former member of staff said:
- “In the main, Weinberg was the only person in the industry who Fowler had direct contact with,”
This particular trap should be avoided this (2nd) time around. The opportunity for the Conservative Party to recapture the Tory working class vote may be at hand. A dignified retirement is all that is asked
E N D
Appendix 1
Brief chronology of pension evolution & reform
1944
The well-known Beveridge Report appeared in 1944. It also ushered in The National Insurance Act (1946).
From 1947 all insured (working) people, employers and the Gov’t (i.e. from general taxation) paid into the National Insurance Fund (NIF). These amounts were was called National Insurance Contributions (or NIC). Only married women did not have to contribute in order to benefit as they could rely / claim on their husband’s contributions.
1950
From this point onwards politicians systematically opened up payments to a wider spread of claimants thus diluting it from its original specific purpose. By the mid-1970s ‘Benefit’ claims that were once strictly based on the contributions paid in by the claimant were abandoned amid no fanfare and claims were henceforth paid on the basis of “need.” This discriminated in favour of women and mothers – and the unemployed idle – and discriminated against men and fathers and those in work.
1979
A Conservative government sweeps to power and views its victory as a mandate to slash the role of the state and cut taxes, especially for the wealthy. The budget, passed by Parliament in 1979, included a fateful change in the formula for basic state pensions. Pensions were no longer to rise in line with wages but in line with inflation (this is one of the key changes that the present Pres. Bush administration is contemplating for America’s Social Security).
1984
A Conservative government tackles what it views as an enduring vestige of 1944 socialism: the system of state pensions for the elderly. Chancellor Nigel Lawson began to express his alarm at projections for the cost of SERPS over the next 50 years. Lawson describes SERPS as “a doomsday machine” and calls its provisions “irresponsible generosity.” The Gov’t declares the current pension programme to be unaffordable in 50 years’ time (i.e. by 2030), and proposes privatisation so that in future a portion of old-age pensions are funded directly by each would-be pensioner.
1985
The Conservatives Gov’t passes pension privatisation legislation. Some SERPS benefits are curtailed. Employees can choose either SERPS or to ‘contract out’ by setting up their own personal pension scheme. A 2% tax rebate incentive is offered to those taking out a new personal pension between 1988 and 1993. (NB. Some years later the returns on these ‘contract out’ or ‘opt out’ schemes prove to be shockingly low).
1988
The Government’s Actuary Department predicted that no more than 500,000 people would take up personal pensions but by 1988 more than 1 million private pensions had been sold, rising to 4.3 million in April 1991. A former official recalls that at the time;
- “We all told the Secretary of State that personal pensions were really only good for the very young or for very high earners.”
In the first five years the number of private pensions sold turned out to be 10 times bigger than those two segments of the population which had previously been thought to benefit most.
1990-92
Economy enters short recession; mortgage holders experience ‘negative equity’ phenomenon.
1992
At a gathering of ministers and civil servants at Chevening, the government gets its first official warning that all was not well. Social Security Secretary Peter Lilley tells ministers that the costs associated with persuading people to ‘opt out’ of occupational and state pension schemes into personal pension plans represent a time bomb ticking away.
The government had paid out £9 billion in rebates from 1988 to 1993 to people who had agreed to contract out; but at the same time the cost savings in reduced Gov’t liability for SERPS was only £3.1 billion. A report by the National Audit Office (1990) confirmed this. What had once been a £1.6-billion surplus in the National Insurance Fund had completely vanished. Worst of all, many workers had left good occupational plans and faced being worse off in retirement.
2001
Stakeholder pensions were launched by the New Labour Gov’t in April 2001. These were designed for people without access to an employer sponsored pension arrangements. They were said by Gov’t to be secure, flexible and offer value for money. The debate leaves the public dazed by the jargon, e.g. GMP. They are described as the opportunity for many more people to save for retirement in a way they can afford.
2002
The Pickering Report into future pensions said workers should be forced to put a significant part of their wages into a company scheme. This would hit around half of employees, i.e. 11 million people. It also suggested that in future employers should not have to raise pension payments to ex-employees in line with inflation. (NB. Were workers to be forced to put significantly more of their wages into a company scheme then ‘demand’ they created, by their spending in the High Street, would fall by the same significant amount).
The Financial Services Authority, the City regulator, warns that someone who retires in their sixties might live for another 30 years. Many U.K. insurance companies, mindful of tough new rules against giving bad advice, began to write to their customers urging them to consider abandoning their private savings and returning to the state pension system.
2004
Department for Work and Pensions figures show that more than 500,000 people abandoned private pensions and moved back into the state system. Government actuaries expect another 250,000 to contract back in the year, i.e. in 2005.
2005
The pensions Commission report, chaired by Lord Turner of Ecchinswell is published in 2005. Adair Turner, its chairman, concluded that the present regime is unsustainable and that ordinary working men and women will have to work for more years, or pay more in taxes and expect less in pension benefits. (NB. That sounds so out of touch given his golden hello and golden good-bye, compared with those of the working class which have either experience unemployment several times over since 2005, or have had pay rises of 1% per annum or less).
Appendix 2
A deflationary and ‘sick’ economy turned solvent
‘Inflation’ coupled to a lack of ‘productivity’ was the curse of the British economy for many decades. Measures applied to end the spiral had only made the pendulum swing from Inflation to Deflation. After a breif recession lasting from 1990 – 1992 a programme of wage deflation was introduced – though this seems to have gone unnoticed at the time.
Wage deflation is a fall in real purchasing power.Inflation and deflation which had perennially handicapped growth in the British economy was is snuffed out in the period John Major was Chancellor and then Prime Minister. At a speech in 2008, John Major quoted from Derek Scott, who was Prime Minister Tony Blair’s adviser who had said:
- “Gordon Brown inherited the best economy of any Chancellor in living memory.”
Speaking some years after he left office (as PM), John Major said:
- “I inherited a sick economy and passed on a sound one”.
That “sound one” came at the price of wage deflation, i.e. a fall in real purchasing power. At the same event John Major expressed the view that Labour Party ‘had squandered it’ while in government; “They have spent, and spent, and spent.” That turning around must be the hope of the new Chancellor of the Exchequer, George Osborne (who inherited the same role but in a far worse situation), and who must be hoping he can equal if not better Major’s stewardship.
In his autobiography John Major writes that during his premiership Interest Rates fell from 14% to 6%; that unemployment was at 1.75 million when he took office, and was at 1.6 million and falling when he left. The government’s annual borrowing over this period rose from £0.5 billion to nearly £46 billion at its peak before falling back to £1 billion. [19]
Speaking in July 2008 shortly after the sub-prime catastrophe and only a few months after Northern Rock had been effectively nationalised (in Feb 2008) he predicted a deep recession was unavoidable.
E N D
Footnotes:
[1] “Iceland staff frozen out of pension” http://www.thisismoney.co.uk/money/news/article-1543541/Iceland-staff-frozen-out-of-pension.html#ixzz3YBHbxJqg
[2] Infamous phrase coined by PM Ted Mr Heath, The Times, 15 May 1973
[3] See http://en.wikipedia.org/wiki/Tanganyika_groundnut_scheme . It authorised spending of £25 million – when Britain was bankrupt after WW2 – to cultivate 150,000 acres in a dry arid region.
[4] “Blair plea on Third World debt falls on deaf ears” July 2000, “The Cologne summit agreed to write off about half the £140 billion owed by the world’s 40 poorest nations. Gordon Brown, the Chancellor, later told cheering delegates to Labour’s annual conference that in 2000 the world would write off £70 billion: “Debt relief once a dream, then a promise, is now becoming a reality.” http://www.telegraph.co.uk/news/worldnews/africaandindianocean/1349895/Blair-plea-on-Third-World-debt-falls-on-deaf-ears.html
[5] See “Review of the Bank of England’s Provision of Emergency Liquidity Assistance in 2008 – 09” (Oct 2012). It makes for sober reading. The London and County Securities company, which triggered the 1971 crisis had as one of its non-executive directors the then leader of the Liberal Party, Jeremy Thorpe MP. Embarrassingly for the high-minded ethical profile of Thorpe it later transpired that he was involved with a company that was charging 280% on risky second mortgages (what today would be termed sub-prime). and when, at the end of the saga in 1973, the collapse of London & County revealed a labyrinthine tangle of financial dealings and conivences (Daily Telegraph, 4th Dec 2014). http://www.telegraph.co.uk/news/obituaries/11273678/Jeremy-Thorpe-obituary.html
[6] See http://www.socialistworker.co.uk/article.php?article_id=5221
[7] See http://www.socialistworker.co.uk/article.php?article_id=7979
[8] http://www.socialistworker.co.uk/article.php?article_id=5508
[9] Elisabeth Croll, an expert on Asian demography, and Jean-Claude Chesnais a leading French demographer. http://news.bbc.co.uk/1/hi/programmes/analysis/4305907.stm
[10] Evening Times, 6 January 2006, http://www.eveningtimes.co.uk/hi/news/5047665.html
[11] See http://dnaindia.com/report.asp?NewsID=1005074
[12] By Helen Rumbelow and Christine Seib , http://www.timesonline.co.uk/article/0,,2-1321062,00.html
[13] Woman’s Hour, BBC. Nov 8th 2005.
[14] “The rape of the National Insurance Fund” http://www.southwark.tv/spag/spagNIFund.asp
[15] National Insurance Fund (NIF) , (£m). Table 10.1 http://www.statistics.gov.uk/STATBASE/Expodata/Spreadsheets/D3987.xls
[16] “Not the General Election” , May 21st 2001 http://www.newstatesman.com/200105210023
[17] Reply by the Government to the Fifth Report of the Select Committee on Social Security, Session 1999-2000 [HC 56]
[18] See http://news.bbc.co.uk/1/hi/programmes/moneybox/3084116.stm
[19] “Real rate of inflation could be 10 per cent, says John Major”, 14th July 2008. http://www.independent.co.uk/news/uk/politics/real-rate-of-inflation-could-be-10-per-cent-says-john-major-866874.html


